I've been spending a lot of time looking at bare-earth DTMs recently, but this is what leaving in the trees and buildings can do for you. Viewshed analysis of a potential development site showing how much screening the trees, buildings and hedgerows provide. If it's pure black, you can't see any part of the site. Presented here as much for the aesthetic effect (though it might not seem quite so aesthetic if that was your back garden).
Showing posts with label lidar. Show all posts
Monday, 19 October 2015
Wednesday, 23 September 2015
Cawthorn Camps, North Yorkshire
Extracted from the newly released EA lidar dataset. Cawthorn camps in North Yorkshire. Something (above) using the Relief Visualization Toolbox and (below) 3D modelling via SAGA.
Tuesday, 15 September 2015
York lidar
The Historic Towns Atlas volume for York would have liked to incorporate a lidar plan, but have unfortunately gone to press too soon. Now that the Environment Agency's restrictive licensing arrangements have given way to an Open Data release they could have used it as they saw fit. Still, here is an image knocked up from the 50cm lidar coverage.
Wednesday, 9 September 2015
Lidar for free!
As of the beginning of this month all of the Environment Agency Lidar data for England has been released as open data. It can be accessed through a new portal. Some have complained of problems, and it can be rather slow loading the background mapping, but I've been able to get my hands on lots of interesting stuff already.
The data is released under Open Government licence which allows commercial use, so it's all there to play with as you see fit. Sadly, in the process we have lost Wales which devolves elsewhere (though through some odd [and yet to be repeated] glitch I managed to download a chunk of the Lleyn peninsula just the other day, so the data seems to be there - hopefully someone will sign it off for release before too long).
Roman temporary camps north and south of Hadrian's Wall just east of Aesica
The data is released under Open Government licence which allows commercial use, so it's all there to play with as you see fit. Sadly, in the process we have lost Wales which devolves elsewhere (though through some odd [and yet to be repeated] glitch I managed to download a chunk of the Lleyn peninsula just the other day, so the data seems to be there - hopefully someone will sign it off for release before too long).
Monday, 1 December 2014
Viking ring forts
Amazingly the danish government has provided open access to lidar survey of the entire country. Of course, I was really hoping to be able to model the Danevirke, but despite the name (and its original function) that now all lies within Germany. However the Viking ring fortresses are rather nice. Here the Aggersborg, Fyrkat and Trelleborg, and below the Aggersborg in 3D.
Only five examples of such fortresses
are known in Denmark. The Nonnebakken fortress at Odense disappeared
beneath the town in the 19th century. The ploughed out remains of a fifth, the Borrering, were long suspected but only recently dated (and not really as 'newly discovered' as some news reports/press releases would have you believe!).
Thursday, 9 January 2014
Burrough Hill Lidar
I was surprised to see EA data at 0.5m centres available for this seemingly random block of Leicestershire countryside until I noticed this. So presumably this derives from the survey commissioned by the University of Leicester, although point density may have been somewhat higher in the original surveys to judge by that nice de-vegetated bare-earth model. Pleasing results from this nonetheless.
The first image is a slope severity plot; the perspective view from the south-west is based on a sky-view factor plot.
Monday, 16 December 2013
Grey Ditch
A blast from the past (but which may become more relevant again in future). Looking south(ish) towards Bradwell from the Hope Valley in Derbyshire. The dark age earthwork Grey Ditch runs across the valley from the left-hand skyline, down across the lower slopes and across the line of the Roman road towards Mich Low on the right hand edge of this view (and probably continuing to cut off the hill saddle just behind). Spent a lot of time in these fields recording the earthwork in detail with EDM (in another life). If I can find the files somewhere, I'll post a comparison (this is from Environment Agency 2m-centred lidar, so the effort with the EDM isn't wasted, yet!).
Thursday, 17 October 2013
Haiwarde 1595 and lidar
Above, a lidar plot from EA data of the Lincolnshire Marsh at Marshchapel showing extensive remains of medieval salt production. Below, the same plot overlain with William Haiwarde's 1595 map of the parish demonstrating the remarkable accuracy of this early mapping (although it has taken a little work in QGIS to make it fit quite this well). Almost as remarkable as his very accurate depiction of the shape of the salterns is the fact that they retain that recognisable shape to this day. At the time of his survey Haiwarde depicted small structures (salt cotes) on the most easterly of the salterns, but these were clearly the last active salterns for no more have been developed beyond these after 1595.
Wednesday, 7 August 2013
Ohio Serpent Mound Lidar
Something from a little further afield. Starting with lidar survey produced by the Ohio Department of Transport. Coverting to .asc via the very useful LASTools and modelling slope severity in SAGA.
The Great Serpent Mound is thought to date to 1070 AD (CE if you like). I find myself as intrigued by the earthworks on the other side of the valley (not fully visible in this view). What looks as though it could just be a river levee turns through 90 degrees at its northern end and may be something much older. Ohio has some very interesting monuments which have benefitted from lidar research.
Thursday, 1 August 2013
Birdoswald lidar
The Roman fort at Birdoswald on Hadrian's Wall sitting high above the steep-sided (and eroding) valley of the River Irthing. The wall itself attaches to the northern corners of the fort running eastwards to a mile-castle just before the steep descent to the river. The Vallum appears at the west of the plot with (intriguing) earthworks just to the north. Sky-view factor plot using EA 1m-centred data.
Wednesday, 31 July 2013
John Pitchford's Witham
John Pitchford's 1733 map of the course of the River Witham from Lincoln to Boston, produced at a scale of 2 and a half inches to the mile (1:25,344), unfortunately does not survive. This version 'correctly reduced and drawn from the original' in 1734 is at nearer 1:80000. Nonetheless, a very accurate piece of survey for its day. It shows the route of the river prior to improvements in the 1870s. Neither of the Projected Cuts laid out here were ever undertaken, the final scheme taking a route inbetween the two. The map is overlain onto a lidar map produced from Environment Agency data showing the detailed topography of the valley and the Witham fens and the course of the prehistoric estuarine river.
Tuesday, 23 July 2013
Maryport lidar
Lidar from the usual source (EA). Slope severity plot looking NE, showing the setting of the Roman fort at Maryport very well.
Here, looking in much the same direction, a sky-view-factor plot showing the impressive detail of the surviving earthworks. Excavations have been ongoing for a year or two. Plenty there to go at.
Thursday, 4 July 2013
Caerwent
The smaller scale image doesn't really do this justice. This is extracted from Environment Agency 0.25m centred lidar survey data. Not much UK coverage at this scale, mostly very tightly focused on coastal zones and river valleys, but they do happen to have covered the site of Venta Silurum. The detail of the wall circuit and bastions, and of exposed Roman building foundations within the town, is quite amazing (for what is, essentially, an off-the-shelf product).
Here, the same expressed as a sky-view factor plot and viewed as a 3D model from the south-west.
Monday, 24 June 2013
Old Sarum
Thursday, 30 May 2013
Viroconium
Next in our tour of Roman sites (once more courtesy of Environment Agency lidar): Wroxeter, Viroconium. The overlay of the layout of the town is from Wacher's Towns of Roman Britain, so not the most up-to-date plan by any means, but it will do to be going on with.
Wednesday, 29 May 2013
Durobrivae - Credenhill - Kenchester
Three lidar images at the same scale: Durobrivae, Credenhill hill fort in Herfordshire and the site of the Roman town at Kenchester a few kilometres to the south. Data courtesy of the Environment Agency again.
Durobrivae lidar
Environment Agency lidar data is now freely available for non-commercial use, so I have been setting about making use of it (after jumping through a few hoops to establish my non-commercial credentials in this instance). Roman town sites are the order of the day, particularly green-field sites, as in this instance at Chesterton/Water Newton (Durobrivae). The site of the town and its defences are very evident in the survey, with the route of Ermine Street through the town to the river crossing and beyond especially clear. Dropping the cropmark plot over the top goes to show how much lidar survey can aid understanding of landscape setting (quite apart from its mapping of earthwork features). The site of the palatial complex at Castor lies towards the northern edge of the map (to be added later).
Wednesday, 12 December 2012
Swineshead Abbey
A slight departure. The idea behind the Lincolnshire Fenland Lidar project was to produce seamless mapping at all scales, from that A0 poster on my wall down to the best resolution that 2m lidar can offer (about 1:5000 in my experience). I still feel the chosen colour ramp works well, but it represents a compromise and individual sites are certainly worth revisiting. This image is of Swineshead Abbey (occupying higher ground slightly south of centre), with the motte and bailey castle Manwar Ings just to the NW. Starting with Environment Agency data as usual, but seeing what SAGA GIS will do for us. I have wondered if the abbey wasn't sitting on a watercourse with access to the sea. Some of the sinuous channel forms here reinforce that idea.
Thursday, 19 July 2012
Lidar visualisation 2
Taking that last map of slope severity and draping it over a 3D surface model. Some things certainly more evident. I hadn't noticed the hollow way ascending the slope in the bottom left previously; earthworks below the woods in the bottom of the valley; still wonder what to make of the mounds on the far hillside. This produced using SAGA GIS which I'm more impressed with the more I get to grips with its capabilities.
Wednesday, 18 July 2012
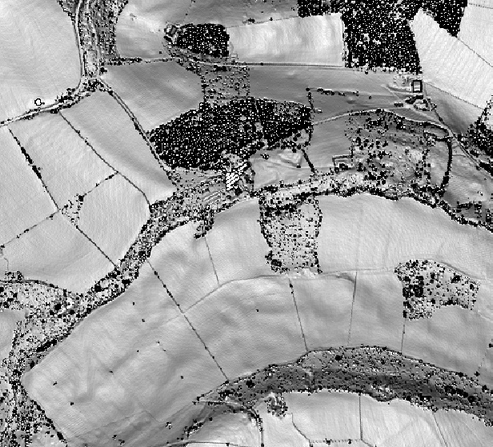
Lidar visualisation
An extract from the Derwent Valley lidar (a pilot study towards the DerwentWISE project). Experimenting with different visualisation techniques. Conventional relief shading, although quite easy to understand, has its downsides in that results can be very dependent on lighting direction. A raft of other techniques has been tried - Sky View Factor, Local Relief Modelling, Insolation Modelling - to varying (but often very good)effect. This plot uses modelling of Slope Severity with pleasing results. I'm particularly interested in the mounds on the hill-top at the north of the image. They don't seem to have been recognised before. Too regular to be natural?
Subscribe to:
Posts (Atom)